


Introduction
Based on Loops analyses of A/B tests, 30- 50% of the product-related experiments companies conduct are flawed. When the A/B test split of users between the treatment group and the control group isn’t balanced or representative, or there are issues with traffic volume or consistency, poor decisions can result. This case study explores the challenges of testing product-related hypotheses and being able to trust your A/B test results. Errors in these tests can result in incorrect conclusions, even if the hypothesis itself is sound. Below is an anonymous Loops customer case study and checklist to help you ensure the accuracy of your A/B tests.
About the Customer
The customer is a B2B product-led growth (PLG) company in the communications industry. Their product is widely used and loved for its time-saving, cost-effective, and creative capabilities.
Bad Signals Can Lead to a Wrong Turn
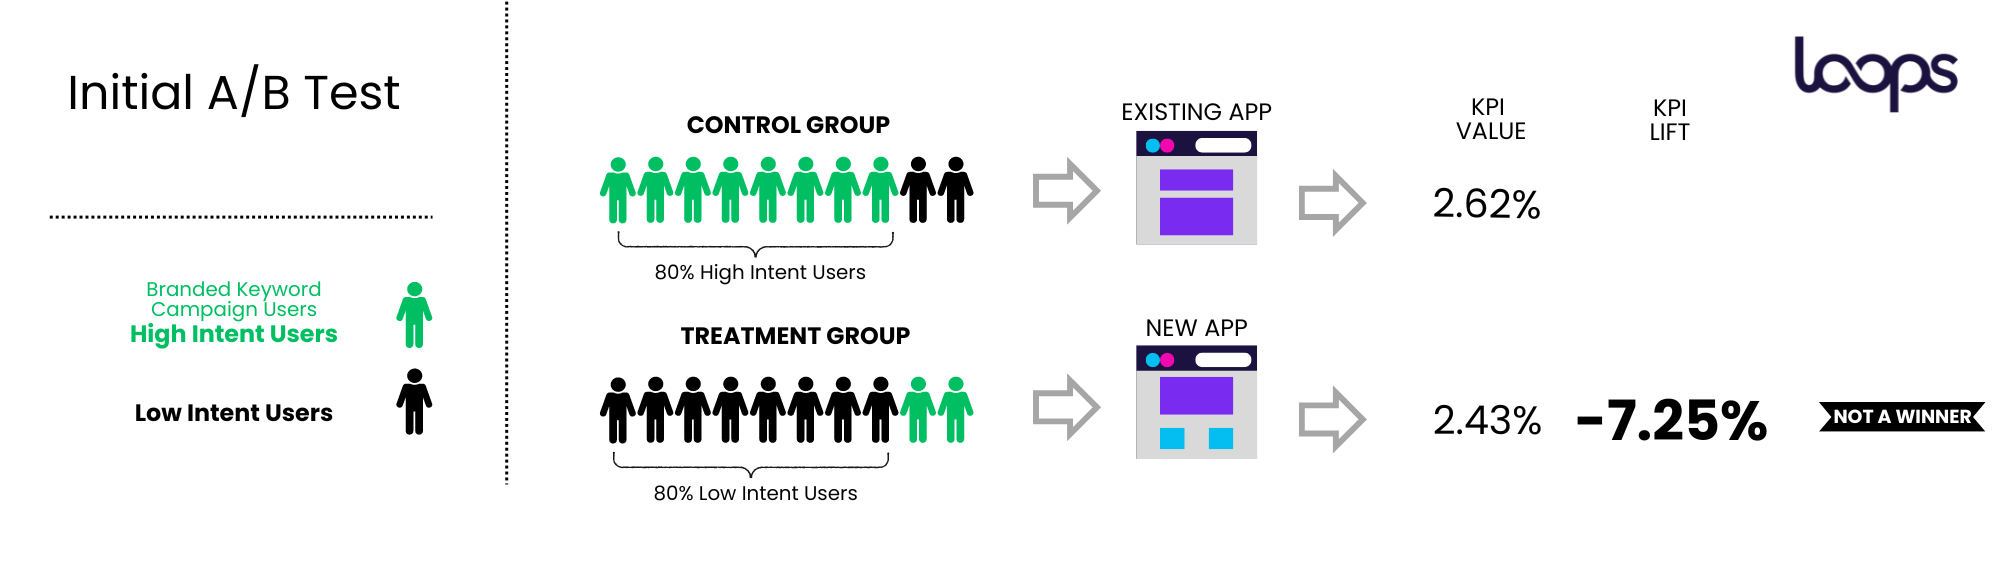
In one particular experiment, the company was trying to improve their Conversion to Paid KPI. They initially reviewed the results in their own dashboards and believed that the variant (treatment group) was losing to the control, based on their analysis. They were about to move on to the next initiatives. At the time, the customer was running branded keywords marketing campaigns, which typically pull in high-intent users. However, In this customer’s case, 80% of the users from branded keywords campaigns went to the control group.
Errors can occur when users are not split evenly between the different groups of the tests for specific segments. For example, when too many high-intent users, specifically from marketing campaigns like theirs, are assigned to one group, while too many low-intent users are assigned to another. Poor test construction, including an imbalance in the user mix between the control and treatment groups, can lead to misleading results.
Here’s an example of how poorly constructed control and treatment groups can skew an A/B test, resulting in an unreliable outcome.
Loops helped the customer find a 12% Core KPI Lift - that they missed with their own dashboards
The user-split issue became evident when examining Loops’ A/B test validation analysis. Loops highlighted the data validation issues and showed how they had skewed the experiment’s results.
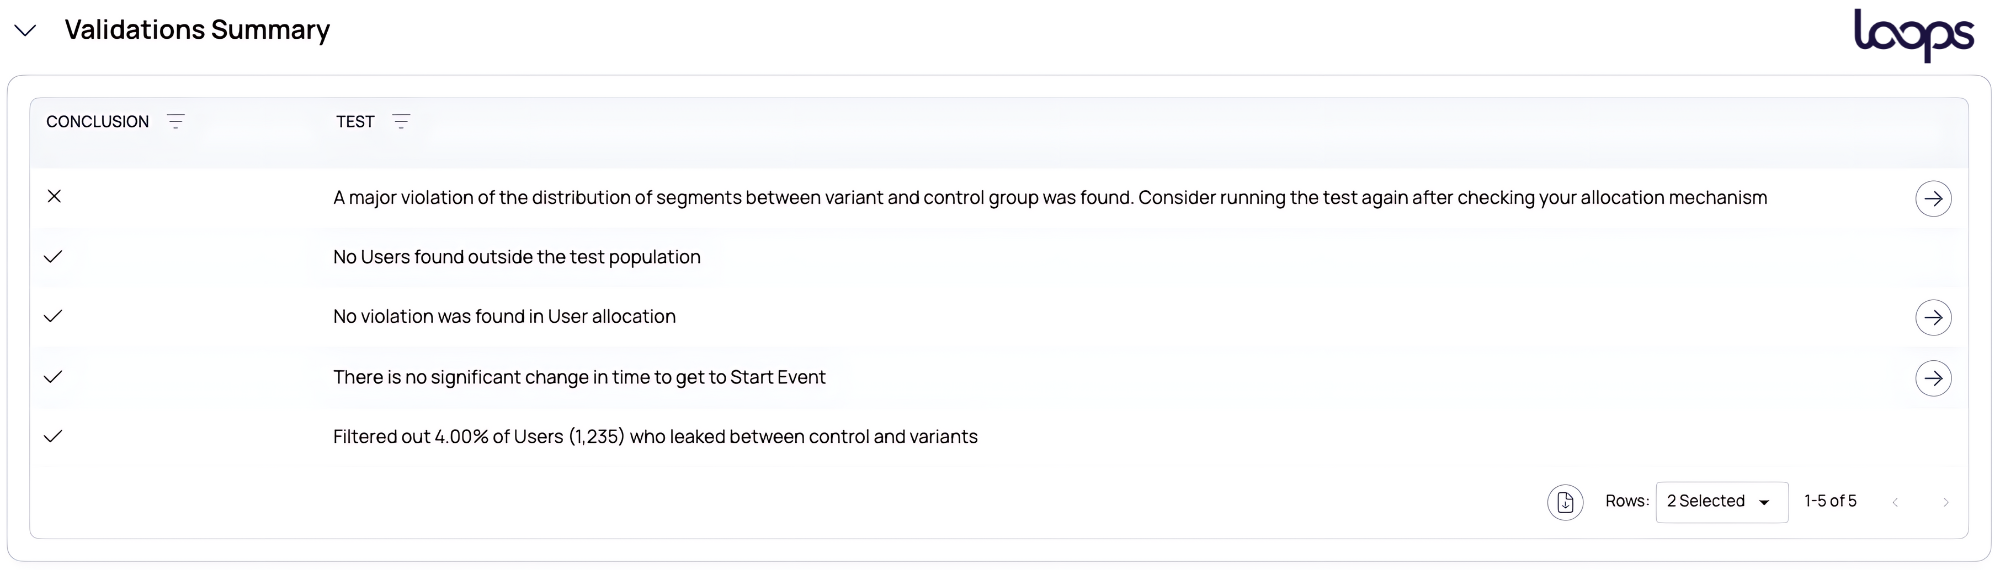
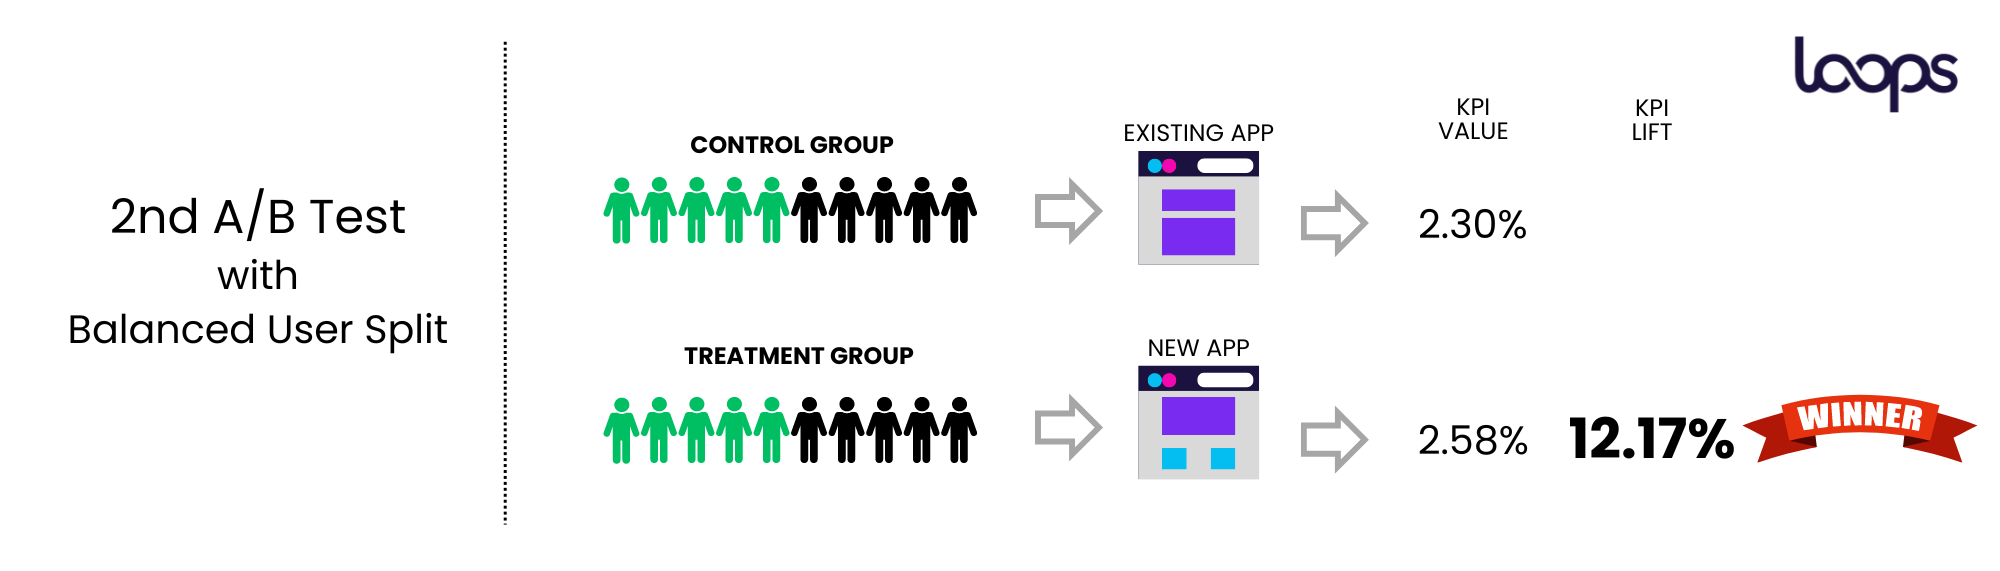
The customer decided to rerun the experiment with the correct split in place, using Loops. In doing so, they discovered that the variant, their hypothesis, was actually winning.
They observed a 12% lift in the conversion KPI - realizing they had almost missed a significant opportunity to improve their metrics.
Checklist for A/B Test Accuracy
To avoid creating unreliable A/B test results, use this checklist:
- Distribution of Segments Across Different Groups:
- Ensure an even distribution of user segments across test groups to avoid skewed results.
- Users from branded search campaigns or those who enabled integration (signals of high intent) demonstrate high-intent, and in this case study too many of these users in the control group made it initially appear that the variant, and the hypothesis they were testing, was losing.
- Leakage Between Groups:
- Prevent users from being part of more than one group (e.g., control and variant). This can happen due to sign-in issues or poorly defined assignment criteria.
- User Allocation Over Time:
- Ensure consistent traffic assignment to all groups from the start of the experiment.
- Each group should receive traffic on all dates to avoid skewed results. In addition, it’s important to verify the split of the traffic is aligned with the settings of the experiments. For example, if 20% of the traffic was assigned to the variant, verify that for each segment 20% of the traffic goes to this variant.
- Test Population Representation:
- Ensure the test population represents the general population in terms of “tenure.” For example, if the test is conducted on 10% of the population, but 80% of this group are mature users (compared to 30% in the general population), the results won’t reflect the real effect on the total population.
- Tenure Validation
- New users and existing users typically behave very differently, so it is important to verify that for every level of user tenure, the traffic split is aligned with the general traffic split of the experiment. For example, if it’s 50%-50% experiment, the new users should be split evenly between the groups.
Conclusion
Although A/B tests are great solution to verify hypotheses, they are sometimes very expensive in terms of time, resources, and traffic and therefore, are not always a viable option. Companies with insufficient traffic and time may take up to six months to achieve statistically significant results. In such cases, consider using Loops’ Release Impact models as an alternative.
By following this checklist, companies can better verify that they are making the right decisions based on their A/B tests. Even a great hypothesis can appear to fail if the test is poorly constructed, so it’s crucial to ensure the integrity of the testing process.


