Case Study – Atera: Insights from Feature-Impact Model led to 34% Lift – with no A/B Testing

Overview:

Using Loops, Atera’s analysts detected that a particular modification was the primary cause of a KPI decline. Armed with this newfound insight, Atera’s team was able to adjust their views about the success of a new feature release, ultimately implementing a third round of updates in the same product area. These subsequent changes resulted in a substantial boost in Atera’s funnel conversion rates. Thanks to the insights provided by Loops, Atera’s team rapidly learned from their previous iterations and could react accordingly until achieving success.

About Atera

Atera is the developer of the world’s first AI-powered IT platform, which includes Remote Monitoring and Management (RMM), Helpdesk, Ticketing, and Advanced Reporting platform,  currently on the market. With more than 12,000 customers in over 105 countries, Atera’s intuitive, all-in-one platform offers IT professionals and businesses improved operational efficiency, seamless integrations, and end-to-end real-time visibility across multiple systems at industry-disruptive pricing. Atera’s platform empowers IT teams of all sizes to maximize efficiency and drive growth and improvements across their entire organizations. To learn more, visit atera.com.

Loops and the Case of Unexpected KPI Drops

Like other companies, Atera undertakes periodic modifications to their funnel in order to bolster product growth. However, during one particular instance, and following a series of updates, Atera observed a rather unexpected decrease in two of their funnel KPIs. In response, the company used Loops, the product analytics platform, to promptly pinpoint the underlying reasons behind the change to one of the product modifications rather than seasonality or other external influencers. Atera’s team adopted the methodology of using a sophisticated pre-post analysis, instead of relying on AB testing which requires more data and time.

Method and Results:

Atera utilizes Loops’ Release Impact analysis, a distinctive, product analytics model which simulates an AB test environment in a pre/post change analysis, to measure changes to their business metrics in each iteration.

First Iteration – a negative impact revealed

Loops surfaced that the release had a significant, negative impact – even on a KPI for which the trend seemed positive (Business Metric #1).
This was a significant finding – while one KPI appeared positive because of many variables that can impact it, the Loops model concluded that the actual effect of the change is negative (you can read HERE how this can happen).

With the second KPI, Business Metric #2, while the trend was negative from the get-go, Loops concluded that the trend was worse than first witnessed.
Only with a solution like Loops, that uses unique causal inference models, is it possible to attribute individual impact to each variable and detect a negative impact in an increasing KPI.

Second Iteration – the impact of a release 

Loops showed that even though different changes were made simultaneously – the decrease in KPIs, especially Business Metric #2, was related to the release.

Third Iteration – a 33.88% Improvement!

Loops helped the team prove that this iteration of improvements caused the KPI to increase significantly and that the impact on Business Metric #1 was 33.88% higher than they initially witnessed (causal change vs. naïve change).

Loops Unique Causal Models Help Product Analytics Teams Get to the Root Cause

Yuval Regev, Head of BI & Analytics, Atera
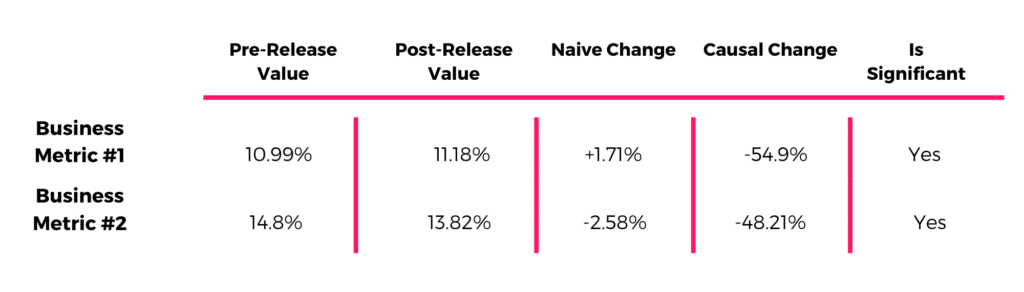
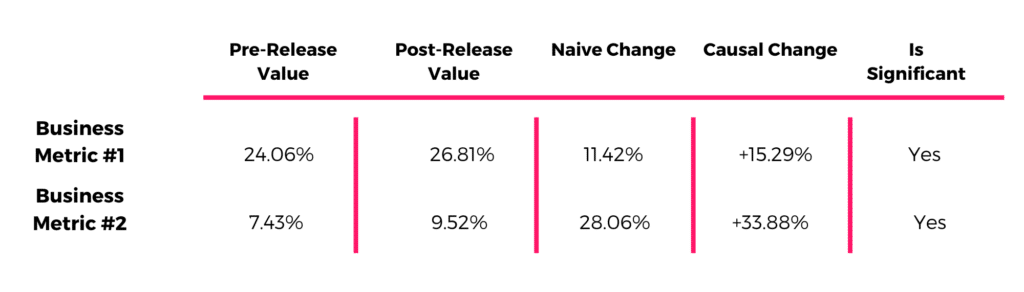
Loops’ unique casual models helped us quickly identify the root cause of changes in KPIs. Even when the change seemed to be positive, these models identified the segments and areas of the product where the change was positive and where we were negatively impacted. By using these Loops algorithms, we now look beyond dashboards and see impact that can’t otherwise be seen.” 

Learn more about Loops: 

Pick your time