About 18Birdies
Established in the year 2014, 18Birdies is a leading golfing social platform and game enhancement tool. With a goal to equip all golfers with the necessary resources to perform their best on and off the course, 18Birdies has become the go-to platform for novice as well as seasoned golfers. Golf enthusiasts rely on 18Birdies to access important information such as distances, plan and keep track of their stats and rounds, improve their game with practice tools and tutorials, and interact with friends, family, and the wider 18Birdies community to exchange experiences and golfing stories.
Why Loops
“The main reason I signed with Loops was to have a set of non-biased eyes on our data that could provide insights I may have missed. In addition to their data analysis capabilities, Loops delivers actionable growth opportunities that have helped us improve our product.”
The Case
When 18Birdies started working with Loops, the platform presented an opportunity to improve on 18Birdies’ pre-set KPIs with the “Goal Driver” analysis. This analysis automatically identifies the features that maximize a company’s KPIs using causal inference models, which enable you to get significant results with minimal traffic.
Loops’ unique causal inference models isolate the real impact of a feature by taking into account all the other influencing parameters (e.g., new users, seasonality, etc.) to understand the real impact of the new feature or product changes.
Within hours, Loops presented 18Birdies with two fascinating findings:
- A feature that was perceived to be negligible, adopted by only 1% of users, was causing a tremendous lift in one of the 18Birdies’ most essential KPIs – Day 2 retention, among adopters.
- Loops also identified that the feature impacts other KPIs, such as conversions to trial and overall retention.
This finding allowed 18Birdies to take a concrete action item to improve these KPIs, and they started to give the feature more exposure during their user onboarding.
The Results
After adopting Loops recommendation, 18Birdies presented the feature during users onboarding and saw a 15% uplift in Day two retention, their most important KPI.
A once-perceived negligible feature significantly contributed to 18Birdies KPIs, thanks to Loops’ unique “Goal Driver” analysis that identified this impact even with an initially low adoption rate.
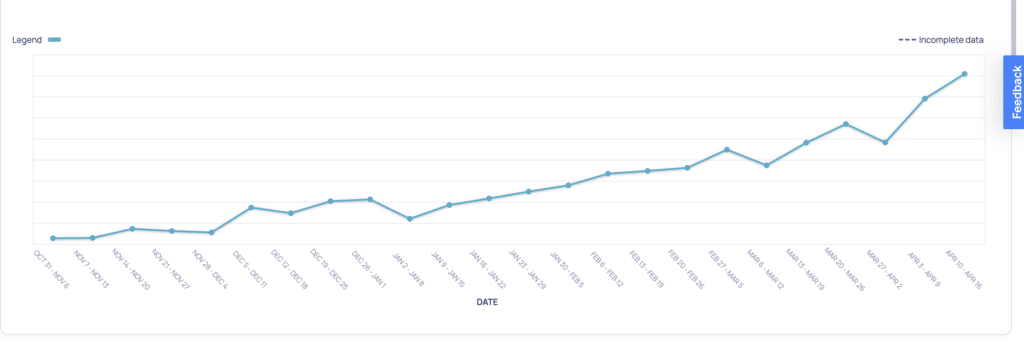
The change in D2 KPI
Jacob Crisp, Head of Product Growth at 18Birdies
“’Previously we had less than 2% of day 1 users setting the feature, but after increasing exposure, we saw 40% of day 1 users engaging with the feature, which led to a 15% lift in D2 retention.”
In Conclusion
To grow KPIs, it’s essential to identify the factors that drive their improvement. Utilizing algorithms to determine causality is valuable for discovering, testing, and implementing these factors. And with so many features and possible journeys users take Loops causal models are a must-have in the product managers tool kit. With Loops, you can identify where to focus on maximizing your KPIs.